Reading Text Data and Plotting in Julia
Reading data into and out of Julia has been the number one pain point for me. MATLAB (and by extension, Octave) makes it very easy. Reading in your text based numeric data is as simple as
data = load('filename');Most options for reading in data in Julia were horrifying. Fortunately, Stack Overflow finally turned up an easy answer. It’s:
data = readdlm("filename")Thank god. While I like control in most languages, I was worried that the lack of ‘easy’ answers here was going to be a real sticking point.
Plotting in Julia is stil something of a pain:
using Plots # library
plotly() # select the plot.ly backend
humid = readdlm("bathroom_humidity") # read in data
gui(plot(humid)) # plot, call gui to show the plot since we're in a script
At the end of the day, we do get a nice plot in the browser:
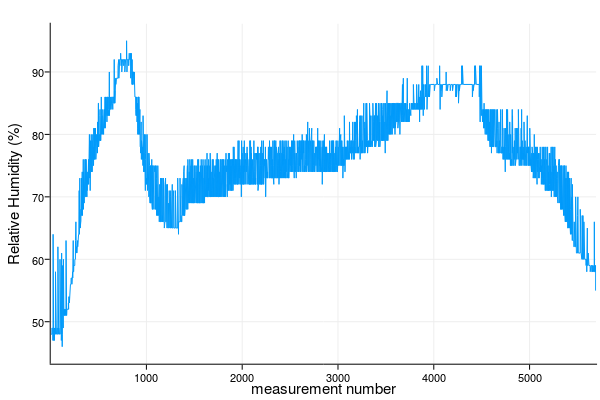
This is real data from this morning. I took a shower while running a temperature and humidity sensor in the room - details on that to come. You can see the spike where I showered and then, as the day warmed up, the humidity in the room rose further. Once I opened the windows, the room dried out. Humidity is sampled about every other second, so this represents a few hours of data.